What is Raman Spectroscopy?
Raman spectroscopy is a non-destructive analytical technique that uses laser light to probe the vibrational, rotational and other low-frequency modes of molecules. When laser light interacts with a sample, most photons are elastically scattered (Rayleigh scattering), but a small fraction undergo inelastic scattering and shift in energy — this shift, known as the Raman shift, provides a unique molecular fingerprint of the material.
How Does Raman Spectroscopy Work?
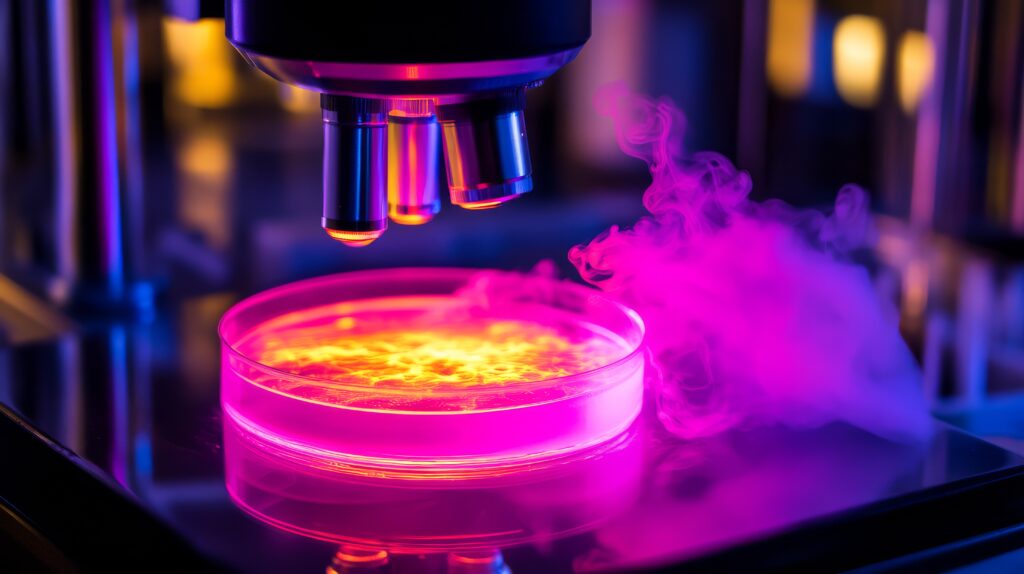
A monochromatic laser beam is focused onto the sample through a microscope objective. Scattered light is collected, filtered to remove the dominant Rayleigh signal, and dispersed onto a CCD detector. The resulting spectrum displays peaks at specific wavenumber positions corresponding to molecular bond vibrations. Each chemical compound produces a unique Raman spectrum, making identification straightforward by comparison with reference libraries.
What Can Raman Spectroscopy Measure?
- Chemical identification — identify unknown compounds and mixtures without sample preparation
- Crystallinity and phase analysis — distinguish amorphous from crystalline material and identify polymorphs
- Stress and strain mapping — measure internal stress in semiconductors and thin films
- Particle and defect characterization — analyze contaminants, inclusions and surface defects
- 2D and 3D chemical imaging — map composition across heterogeneous samples with sub-micron resolution
Key Advantages of Raman Spectroscopy
- No sample preparation required — measure solids, liquids, powders and gases directly
- Non-destructive — the sample is unaffected after measurement
- High spatial resolution — confocal systems achieve less than 1 µm spot size
- Compatible with aqueous samples — water produces very weak Raman signals
- Rapid measurement — spectra acquired in seconds to minutes
Raman Spectroscopy Applications
Raman spectroscopy is used across a remarkably broad range of fields:
- Pharmaceuticals — API identification, polymorph screening, tablet uniformity mapping
- Materials science — graphene characterization, carbon nanotube quality, semiconductor analysis
- Geology and mineralogy — mineral identification in rock sections and gemstone authentication
- Forensics — detection of drugs, explosives and document alterations
- Art and cultural heritage — pigment identification in paintings and historical artifacts
- Food and agriculture — adulteration detection and quality control
Choosing a Raman Spectrometer
The right Raman system depends on your application. Key parameters to consider include laser excitation wavelength (532, 633, 785 or 1064 nm), spectral resolution, detector sensitivity, spatial resolution and whether mapping or imaging capability is required. HORIBA Scientific Raman systems offer modular configurations from routine benchtop analyzers to high-end research platforms with automated mapping and correlative microscopy capabilities.
Raman vs. FTIR Spectroscopy
Both Raman and FTIR measure molecular vibrations but are complementary techniques. FTIR is more sensitive to polar functional groups and is well-suited for gases and thin films, while Raman is better for non-polar bonds, aqueous samples and high-spatial-resolution imaging. Many laboratories benefit from having both techniques available.
Contact NewRoad to discuss which Raman spectroscopy solution is right for your laboratory.